Ps
Common PS option available:
| Option | Working | |
|---|---|---|
| 1 | e | e option it displays running Daemons. |
| 2 | f | with the F option it displays processes with full options. |
| 3 | l | with the L option it would list more information on those processes. |
| 4 | ef | we were to combine e and F together that would display all processes and Daemons on all TTYS. |
| 5 | a | a would list all processes that run on terminals. |
| 6 | x | X would list all processes that do not run on terminals. |
| 7 | aux | we were to combine a U and X that would list all processes running on or off terminals and it would format the results with additional information similar to a long listing. |
当执行 ps -ef 命令后通常会看到如下:
The fields are simple to understand and useful when troubleshooting performance problems:
| Field | Description |
|---|---|
| C | CPU Usage. |
| CMD | The command or process name with path. |
| PID | Process ID. |
| PPID | Parent Process ID: The parent process is the one that spawned the process. |
| STIME | Start Time for the process. |
| TIME | CPU Time for the process. |
| TTY | The user terminal that spawned the process. System process will show a ?. |
| UID | User ID of the process owner. |
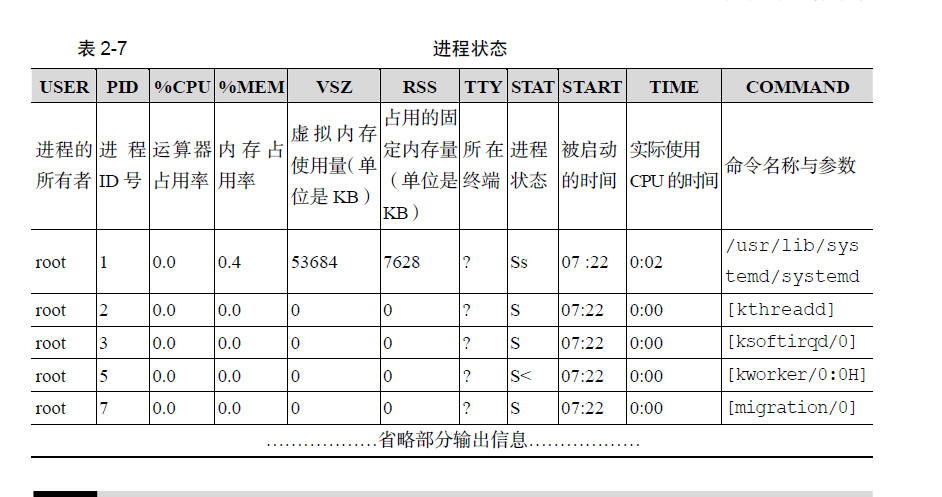
当执行 ps aux 命令后通常会看到如表2-7 所示的进程状态,表2-7 中只是列举了部分输
出值,而且正常的输出值中不包括中文注释。
root      9202 13.6 16.1 6049744 1231204 ?     Sl   Apr19 446:00 java -Dspring.sleuth.stream.enabled=false -javaagent:/home/superadmin/agent/skywalking-agent.jar -Dskywalking.agent.service_name=ec.kfc.mobileordering.api.v3_0_0 -jar mobileordering.api.jar --properties.application.brand=kfc --properties.eureka.servers=http://10.218.223.135:5678/eureka/ --properties.application.cprofile=mobileordering --properties.application.port=8081 --properties.application.version=v3_0_0 --spring.profiles.active=local


root      9203  7.8 12.5 5985656 958092 ?      Sl   Apr19 257:48 java -Dspring.sleuth.stream.enabled=false -javaagent:/home/superadmin/agent/skywalking-agent.jar -Dskywalking.agent.service_name=ec.kfc.mobileordering.activity.v3_0_0 -jar mobileordering.activity.jar --properties.application.brand=kfc --properties.eureka.servers=http://10.218.223.135:5678/eureka/ --properties.application.cprofile=mobileordering --properties.application.port=8082 --properties.application.version=v3_0_0 --spring.profiles.active=local
Top
refer to : https://www.man7.org/linux/man-pages/man1/top.1.html
top命令–动态实时显示Linux系统进程
top命令相当于Windows下的任务管理器,能够实时显示系统进程情况,查看系统负载等信息。
$ top
top - 16:22:05 up 44 days,  6:57,  1 user,  load average: 0.00, 0.01, 0.05
Tasks:  65 total,   1 running,  64 sleeping,   0 stopped,   0 zombie
%Cpu(s):  6.2 us,  0.0 sy,  0.0 ni, 93.8 id,  0.0 wa,  0.0 hi,  0.0 si,  0.0 st
KiB Mem :  1016168 total,   171624 free,   133264 used,   711280 buff/cache
KiB Swap:        0 total,        0 free,        0 used.   709152 avail Mem

  PID USER      PR  NI    VIRT    RES    SHR S %CPU %MEM     TIME+ COMMAND
    1 root      20   0  125200   3372   2152 S  0.0  0.3   0:40.77 systemd
    2 root      20   0       0      0      0 S  0.0  0.0   0:00.09 kthreadd
    3 root      20   0       0      0      0 S  0.0  0.0   0:26.30 ksoftirqd/0
...
第一行信息–系统时间及负载(同uptime命令的执行结果)
top - 16:22:05 up 44 days,  6:57,  1 user,  load average: 0.00, 0.01, 0.05

16:22:05  //当前系统时间
up 44 days, 6:57  //系统运行时间,格式为日,时,分。这里表示已经运行了44天又6小时57分钟。
1 user  //当前登录的用户数
load average: 0.00, 0.01, 0.05  //系统负载,分别表示最近1分钟,5分钟,15分钟的平均负载值。
system load avg over the last 1, 5 and 15 minutes
系统负载:负载均值是基于内核的数量决定的,以100%负载计算
单核CPU,负载在0—1.00之间是正常的,超过1.00就是超负荷,理想值是0.7
多核CPU,负载值不应超过总核心数,CPU核心数 * 理想值0.7 = 理想负荷
例如一个双核CPU值为2.00则表示100%负载;4核CPU负载不超过2.8则表示没有出现高负荷(4*0.7=2.8)
在实际应用中,重点关注5分钟,15分钟的负载均值,当达到0.7时,就需要调查原因了。
第二行信息–系统进程数
Tasks:  65 total,   1 running,  64 sleeping,   0 stopped,   0 zombie

分别表示进程总数,正在运行的进程数,睡眠的进程数,已经停止的进程数,僵尸进程数
僵尸进程:表示已经终止,但仍然保留一些信息的进程
僵尸进程无法使用kill清理,如果要手动清理僵尸进程,需要找到其父进程,kill掉父进程后,init进程将接管该僵尸进程(linux中所有的子进程都需要有父进程,当父进程被kill后,其所有子进程将过继给init进程),init进程隔一段时间去调用wait(),来清除僵尸进程
第三行信息–CPU信息
%Cpu(s):  6.2 us,  0.0 sy,  0.0 ni, 93.8 id,  0.0 wa,  0.0 hi,  0.0 si,  0.0 st

# 按`1`键展开或合并,可查看多个(或多核)CPU信息
6.2 us  //用户空间占用CPU的百分比
0.0 sy  //内核空间占用CPU的百分比
0.0 ni  //用户进程空间内改变过优先级的进程占用CPU的百分比
93.8 id  //空闲CPU百分比
0.0 wa  //IO等待占用CPU的百分比
0.0 hi  //硬中断占用CPU的百分比
0.0 si  //软中断占用CPU的百分比
0.0 st  //虚拟服务hypervisor占用百分比

# man帮助中的解释
us, user    : time running un-niced user processes
sy, system  : time running kernel processes
ni, nice    : time running niced user processes
id, idle    : time spent in the kernel idle handler
wa, IO-wait : time waiting for I/O completion
hi : time spent servicing hardware interrupts
si : time spent servicing software interrupts
st : time stolen from this vm by the hypervisor
第四行信息–内存和swap交换分区
KiB Mem :  1016168 total,   171624 free,   133264 used,   711280 buff/cache
KiB Swap:        0 total,        0 free,        0 used.   709152 avail Mem

Mem内存:分别表示物理内存总量,空闲内存,已使用的内存,缓冲区和缓存区占用的内存
Swap交换分区:分别表示交换分区大小,空闲交换分区,已使用的交换分区,可用的内存
This portion consists of two lines which may express values in kibibytes (KiB) through exbibytes (EiB) depending on the scaling factor enforced with the ‘E’ interactive command. The
/proc/meminfo source fields are shown in parenthesis.
   Line 1 reflects physical memory, classified as:
       total          ( MemTotal )
       free           ( MemFree )
       used           ( MemTotal - MemAvailable )
       buff/cache     ( Buffers + Cached + SReclaimable )

   Line 2 reflects mostly virtual memory, classified as:
       total          ( SwapTotal )
       free           ( SwapFree )
       used           ( SwapTotal - SwapFree )
       avail          ( MemAvailable, which is physical memory )
The avail number on line 2 is an estimation of physical memory available for starting new applications, without swapping.
Unlike the free field, it attempts to account for readily reclaimable page cache and memory slabs. It is available on kernels 3.14, emulated on kernels 2.6.27+, otherwise the same as free.
buff/cache
buffers和cache都是内存中存放的数据,
不同的是,buffers存放的是准备写入磁盘的数据,而cache存放的是从磁盘中读取的数据。
在Linux系统中,守护进程(daemon)会定期把buffers中的数据写入的磁盘,也可以使用sync命令手动把buffers中的数据写入磁盘。**使用buffers可以把分散的I/O操作集中起来,减少了磁盘寻道的时间和磁盘碎片。cache是Linux把读取频率高的数据,放到内存中以减少I/O,Linux中cache没有固定大小,根据使用情况自动增加或删除。
手动把buffers写入硬盘并清空cache
$ sync && echo 3 > /proc/sys/vm/drop_caches
Swap(内存交换区)
是硬盘上的一块空间。在内存不足的情况下,操作系统把内存中不用的数据存到硬盘的交换区,腾出内存来让别的程序运行。因此,开启swap会一定程度的引起 I/O 性能下降(阿里服务器默认不开)。
进程信息
PID USER  PR  NI    VIRT    RES    SHR S %CPU %MEM     TIME+ COMMAND
  1 root  20   0  125200   3372   2152 S  0.0  0.3   0:40.77 systemd
  2 root  20   0       0      0      0 S  0.0  0.0   0:00.09 kthreadd

列名    含义
PID     进程id
PPID    父进程id
RUSER   Real user name
UID     进程所有者的用户id
USER    进程所有者的用户名
GROUP   进程所有者的组名
TTY     启动进程的终端名。不是从终端启动的进程则显示为?
PR      优先级
NI      nice值。负值表示高优先级,正值表示低优先级
P       最后使用的CPU,仅在多CPU环境下有意义
%CPU    上次更新到现在的CPU时间占用百分比
TIME    进程使用的CPU时间总计,单位秒
TIME+   进程使用的CPU时间总计,单位1/100秒
%MEM    进程使用的物理内存百分比
VIRT    进程使用的虚拟内存总量,单位kb。VIRT=SWAP+RES
SWAP    进程使用的虚拟内存中,被换出的大小,单位kb
RES     进程使用的、未被换出的物理内存大小,单位kb。RES=CODE+DATA
CODE    可执行代码占用的物理内存大小,单位kb
DATA    可执行代码以外的部分(数据段+栈)占用的物理内存大小,单位kb
SHR     共享内存大小,单位kb
nFLT    页面错误次数
nDRT    最后一次写入到现在,被修改过的页面数。
S       进程状态(D=不可中断的睡眠状态,R=运行,S=睡眠,T=跟踪/停止,Z=僵尸进程)
COMMAND 进程名称(命令名/命令行)
WCHAN   若该进程在睡眠,则显示睡眠中的系统函数名
Flags   任务标志,参考sched.h
关于 VIRT/RES/SHR 的详解区别
VIRT:virtual memory usage
1、进程“需要的”虚拟内存大小,包括进程使用的库、代码、数据等
2、假如进程申请100m的内存,但实际只使用了10m,那么它会增长100m,而不是实际的使用量
RES:resident memory usage 常驻内存
1、进程当前使用的内存大小,但不包括swap out
2、包含其他进程的共享
3、如果申请100m的内存,实际使用10m,它只增长10m,与VIRT相反
4、关于库占用内存的情况,它只统计加载的库文件所占内存大小
SHR:shared memory
1、除了自身进程的共享内存,也包括其他进程的共享内存
2、虽然进程只使用了几个共享库的函数,但它包含了整个共享库的大小
3、计算某个进程所占的物理内存大小公式:RES – SHR
4、swap out后,它将会降下来
DATA
1、数据占用的内存。如果top没有显示,按f键可以显示出来
2、真正的该程序要求的数据空间,是真正在运行中要使用的
自定义显示列
在top命令中按f键可以查看显示的列信息,默认按%CPU排序。可以通过上下方向键选择,向右方向键选择移动列,移动到合适位置后通过向左方向键或回车确定移动。
space空格键标记或取消选择列,按s键设置当前项为默认排序列,q或Esc退出。
进程字段排序
b键高亮显示运行状态的进程,默认会显示top进程,y键关闭或打开高亮功能。
x键高亮显示排序列,默认%CPU,通过shift + >或shift + <可以向右或向左改变排序列
灵活使用top
命令行
常用参数:
-b:以批处理模式操作,可以把top输出的内容以可读的形式写入文件,如top -n 3 -b >> top.txt
-c:显示完整的命令行(COMMAND),想查看进程执行的具体位置时非常有用
-d:屏幕刷新间隔时间
-s:使用安全模式,即取消交互式命令
-S:指定累积模式
-i:不显示任何闲置或者僵死进程
-u<用户名>:指定用户名
-p<进程号>:指定进程
-n<次数>:指定循环显示的次数,到了次数自己退出
-H Threads toggle 加上这个选项启动top,top一行显示一个线程。否则,它一行显示一个进程。

top -d 2  //每2秒刷新一次屏幕
top -c  //显示进程的完整命令行参数(默认只有进程名)
top -p 12345 -p 6789  //每隔5秒显示pid是12345和pid是6789的两个进程的资源占用情况
top -d 2 -c -p 123456  //每隔2秒显示pid是12345的进程的资源使用情况,并显示该进程启动的命令行参数
-o, --sort-override = FIELDNAME
    Specifies the name of the field on which tasks will be sorted, independent of what is reflected in the configuration file.
   You can prepend a ‘+’ or ‘-’ to the field name to also  override the sort direction.  A leading ‘+’ will force sorting high to low, whereas a ‘-’ will ensure a low to high ordering.

   This option exists primarily to support automated/scripted batch mode operation.
交互式
执行top命令,显示系统状态界面(同时也是交互界面),输入交互命令:
1:切换显示多核CPU信息
h:帮助信息
k:终止一个进程
i:忽略闲置和僵死进程,只显示正在运行的进程
q:退出程序
r:重新安排一个进程的优先级别
S:切换到累计模式
s:设置刷新时间间隔(单位为s),如果有小数,就换算成ms。输入0值则系统将不断刷新,默认值是5s
l:切换显示平均负载和启动时间信息
m:切换显示内存信息
t:切换显示进程和CPU状态信息
c:切换显示命令名称和完整命令行
M:根据驻留内存大小进行排序
P:根据CPU使用百分比大小进行排序
T:根据时间/累计时间进行排序
W:将当前设置写入~/.toprc文件中,下次启动将自动调用toprc文件的设置
其他实用命令
# 如何通过 shell 脚本监控 top 命令并抓取某几个进程的信息?
$ top -b -n 3 | grep -E "mysql | apache2" >> top.log

# 如何用top只监视某个进程的状态?用pstree -p取得进程PID, 然后再监控
$ pstree -p | grep apache2
$ top -p 2038,13734,13735

# 监控java线程数
$ ps -eLf | grep java | wc -l

# 监控网络客户连接数
$ netstat -n | grep tcp | grep 侦听端口 | wc -l

# 获取某进程中运行中的线程数量(PID指的是进程ID)
$ ls /proc/PID/task | wc -l
在linux中还有一个命令pmap,来输出进程内存的状况,可以用来分析线程堆栈pmap PID
实际演示
每隔3秒,查看进程,按照内存大小,进行排序
top -c -d 3 -o +%MEM
每隔3秒,查看下进程,按照内存大小,进行排序,并且将结果,输出到wptop.txt文件中,总共循环5次
top -b -c -d 3 -n 5 -o +%MEM >> wptop.txt
实战场景
查看某个java进程的线程 总数量 和 详细信息
先查看进程
[root@localhost ~]# ps -ef | grep java

root        1679       1  0  2022 ?        02:47:25 /usr/local/jdk1.8.0_341/bin/java -Djava.ext.dirs=/usr/local/jdk1.8.0_341/jre/lib/ext:/usr/local/jdk1.8.0_341/lib/ext -Xms512m -Xmx512m -Xmn256m -Dnacos.standalone=true -Dnacos.member.list= -Xloggc:/home/tools/nacos/logs/nacos_gc.log -verbose:gc -XX:+PrintGCDetails -XX:+PrintGCDateStamps -XX:+PrintGCTimeStamps -XX:+UseGCLogFileRotation -XX:NumberOfGCLogFiles=10 -XX:GCLogFileSize=100M -Dloader.path=/home/tools/nacos/plugins/health,/home/tools/nacos/plugins/cmdb,/home/tools/nacos/plugins/selector -Dnacos.home=/home/tools/nacos -jar /home/tools/nacos/target/nacos-server.jar --spring.config.additional-location=file:/home/tools/nacos/conf/ --logging.config=/home/tools/nacos/conf/nacos-logback.xml --server.max-http-header-size=524288 nacos.nacos
root       65667       1  0  2022 ?        00:19:33 /usr/bin/java -Djava.awt.headless=true -jar /usr/share/java/jenkins.war --webroot=/var/cache/jenkins/war --httpPort=7500 --accessLoggerClassName=winstone.accesslog.SimpleAccessLogger --simpleAccessLogger.format=combined --simpleAccessLogger.file=/var/log/jenkins/access_log
root      762804       1  0 Jan05 ?        00:09:05 java -jar clear-data-0.0.1-SNAPSHOT.jar
root     1840526       1  1 Jan07 ?        01:35:13 java -jar iot-data-api.jar
root     3520989       1  0 Jan11 ?        00:04:25 java -jar iot-manage.jar
root     3783529 3781884  0 10:09 pts/0    00:00:00 grep --color=auto java
我们找到了,进程id为3520989 的 进程。
查看该进程中,总共有多少线程:
[root@localhost ~]# ps -o nlwp 3520989
NLWP
 305
nlwp含义是number of light-weight process,即线程 (轻量级进程) 的数量。
查看,某个进程中,每个线程的详细信息:
方法一:使用ps
ps -T -p 进程id
如下:
[root@localhost ~]# ps -T -p 3520989
    PID    SPID TTY          TIME CMD
3520989 3520989 ?        00:00:00 java
3520989 3520991 ?        00:00:15 java
3520989 3520992 ?        00:00:00 java
3520989 3520993 ?        00:00:00 java
3520989 3520994 ?        00:00:00 java
3520989 3520995 ?        00:00:00 java
3520989 3520996 ?        00:00:00 java
3520989 3520997 ?        00:00:00 java
3520989 3520998 ?        00:00:00 java
3520989 3520999 ?        00:00:00 java
3520989 3521000 ?        00:00:00 java
3520989 3521001 ?        00:00:00 java
3520989 3521002 ?        00:00:00 java
3520989 3521003 ?        00:00:00 java
3520989 3521004 ?        00:00:00 java
3520989 3521005 ?        00:00:00 java
3520989 3521006 ?        00:00:00 java
3520989 3521007 ?        00:00:23 VM Thread
3520989 3521008 ?        00:00:00 Reference Handl
3520989 3521009 ?        00:00:00 Finalizer
3520989 3521010 ?        00:00:00 Signal Dispatch
3520989 3521011 ?        00:00:11 C2 CompilerThre
3520989 3521012 ?        00:00:12 C2 CompilerThre
3520989 3521013 ?        00:00:11 C2 CompilerThre
SPID 表示线程id
方法二:使用top命令
top -H -p 进程id
如下:
  [root@localhost ~]# top -H -p 3520989
top - 10:24:57 up 22 days, 19:35,  1 user,  load average: 0.09, 0.09, 0.14
Threads: 305 total,   0 running, 305 sleeping,   0 stopped,   0 zombie
%Cpu(s):  0.8 us,  0.2 sy,  0.0 ni, 98.8 id,  0.0 wa,  0.0 hi,  0.0 si,  0.0 st
MiB Mem :  31579.1 total,    264.4 free,  10203.8 used,  21110.9 buff/cache
MiB Swap:  15952.0 total,  15669.7 free,    282.3 used.  19456.2 avail Mem

    PID USER      PR  NI    VIRT    RES    SHR S  %CPU  %MEM     TIME+ COMMAND
3521016 root      20   0   19.9g   2.7g  21220 S   0.3   8.8   0:14.30 C2 CompilerThre
3521017 root      20   0   19.9g   2.7g  21220 S   0.3   8.8   0:12.17 C2 CompilerThre
3521139 root      20   0   19.9g   2.7g  21220 S   0.3   8.8   0:02.12 quartzScheduler
3521141 root      20   0   19.9g   2.7g  21220 S   0.3   8.8   0:02.10 quartzScheduler
3521218 root      20   0   19.9g   2.7g  21220 S   0.3   8.8   0:00.08 http-nio-8082-e
3520989 root      20   0   19.9g   2.7g  21220 S   0.0   8.8   0:00.00 java
3520991 root      20   0   19.9g   2.7g  21220 S   0.0   8.8   0:15.33 java
3520992 root      20   0   19.9g   2.7g  21220 S   0.0   8.8   0:00.58 java
3520993 root      20   0   19.9g   2.7g  21220 S   0.0   8.8   0:00.57 java
3520994 root      20   0   19.9g   2.7g  21220 S   0.0   8.8   0:00.58 java
3520995 root      20   0   19.9g   2.7g  21220 S   0.0   8.8   0:00.56 java
3520996 root      20   0   19.9g   2.7g  21220 S   0.0   8.8   0:00.58 java
3520997 root      20   0   19.9g   2.7g  21220 S   0.0   8.8   0:00.59 java
3520998 root      20   0   19.9g   2.7g  21220 S   0.0   8.8   0:00.59 java
3520999 root      20   0   19.9g   2.7g  21220 S   0.0   8.8   0:00.55 java
3521000 root      20   0   19.9g   2.7g  21220 S   0.0   8.8   0:00.58 java
3521001 root      20   0   19.9g   2.7g  21220 S   0.0   8.8   0:00.58 java
3521002 root      20   0   19.9g   2.7g  21220 S   0.0   8.8   0:00.59 java
3521003 root      20   0   19.9g   2.7g  21220 S   0.0   8.8   0:00.58 java
3521004 root      20   0   19.9g   2.7g  21220 S   0.0   8.8   0:00.58 java
3521005 root      20   0   19.9g   2.7g  21220 S   0.0   8.8   0:00.59 java
3521006 root      20   0   19.9g   2.7g  21220 S   0.0   8.8   0:00.59 java
3521007 root      20   0   19.9g   2.7g  21220 S   0.0   8.8   0:23.56 VM Thread
3521008 root      20   0   19.9g   2.7g  21220 S   0.0   8.8   0:00.02 Reference Handl
3521009 root      20   0   19.9g   2.7g  21220 S   0.0   8.8   0:00.03 Finalizer
3521010 root      20   0   19.9g   2.7g  21220 S   0.0   8.8   0:00.00 Signal Dispatch
3521011 root      20   0   19.9g   2.7g  21220 S   0.0   8.8   0:11.92 C2 CompilerThre
可以看到,该进程内部有305个线程;
如果想将结果,输出到一个文本中,方便查看。使用以下命令
top -H -p 3520989 -n 1 -b >top.txt
top.txt 的内容如下:
top - 10:38:29 up 22 days, 19:48,  1 user,  load average: 0.88, 0.43, 0.26
Threads: 305 total,   0 running, 305 sleeping,   0 stopped,   0 zombie
%Cpu(s):  0.0 us,  0.6 sy,  0.0 ni, 99.4 id,  0.0 wa,  0.0 hi,  0.0 si,  0.0 st
MiB Mem :  31579.1 total,    286.0 free,  10204.8 used,  21088.4 buff/cache
MiB Swap:  15952.0 total,  15673.2 free,    278.8 used.  19510.1 avail Mem

    PID USER      PR  NI    VIRT    RES    SHR S  %CPU  %MEM     TIME+ COMMAND
3520989 root      20   0   19.9g   2.7g  21220 S   0.0   8.8   0:00.00 java
3520991 root      20   0   19.9g   2.7g  21220 S   0.0   8.8   0:15.33 java
....省略
3521006 root      20   0   19.9g   2.7g  21220 S   0.0   8.8   0:00.59 java
3521007 root      20   0   19.9g   2.7g  21220 S   0.0   8.8   0:23.94 VM Thread
3521008 root      20   0   19.9g   2.7g  21220 S   0.0   8.8   0:00.02 Reference Handl
3521009 root      20   0   19.9g   2.7g  21220 S   0.0   8.8   0:00.03 Finalizer
3521010 root      20   0   19.9g   2.7g  21220 S   0.0   8.8   0:00.00 Signal Dispatch
3521011 root      20   0   19.9g   2.7g  21220 S   0.0   8.8   0:12.06 C2 CompilerThre
3521012 root      20   0   19.9g   2.7g  21220 S   0.0   8.8   0:12.69 C2 CompilerThre
....省略
3521931 root      20   0   19.9g   2.7g  21220 S   0.0   8.8   0:00.02 com.alibaba.nac
3523230 root      20   0   19.9g   2.7g  21220 S   0.0   8.8   0:00.00 Java2D Disposer
....省略
3792022 root      20   0   19.9g   2.7g  21220 S   0.0   8.8   0:00.00 nacos-grpc-clie
3792027 root      20   0   19.9g   2.7g  21220 S   0.0   8.8   0:00.00 nacos-grpc-clie
可以看到,java线程总共有18个,tomcat的connector线程总共有102个(以http-nio-8082开头的),nacos的线程数总共有103个(以com.alibaba.nac开头的) ,logback的线程数有3个(以logback开头的)等。
查看内存占用最大的进程
方法一:使用ps
[root@KSSHUAT00339 ~]# ps aux --sort=-%mem
USER       PID %CPU %MEM    VSZ   RSS TTY      STAT START   TIME COMMAND
root     30584  1.2 12.4 5976832 1015548 ?     Sl   Oct06  35:15 /opt/jdk8/bin/java -jar /opt/promotion/app/20221006193159/promotion.calculate.servi
root     30169  1.7  8.7 5908996 713448 ?      Sl   Oct06  50:43 /opt/jdk8/bin/java -jar /opt/promotion/app/20221006193159/promotion.loading.service
root     22288  1.0  0.7 522420 62732 ?        Tl   Jul14 1239:19 ./titanagent -d
root      5147  0.0  0.3 626692 29500 ?        Ssl  Apr18  31:57 /usr/sbin/rsyslogd -n
root      2523  0.0  0.2  55856 20308 ?        Ss   Apr18  15:01 /usr/lib/systemd/systemd-journald
root      5500  0.2  0.2 320656 17512 ?        S    Apr18 501:22 easy_collector
root      5512  0.0  0.2 462668 17256 ?        Sl   Apr18  58:46 easy_monitor
root      5501  0.2  0.2 382108 16720 ?        S    Apr18 676:59 easy_collector
root      5145  0.1  0.1  63332 16300 ?        Ssl  Apr18 381:48 /usr/share/filebeat/bin/filebeat -c /etc/filebeat/filebeat.yml -path.home /usr/shar
root      5148  0.0  0.1 573920 15356 ?        Ssl  Apr18  55:00 /usr/bin/python2 -Es /usr/sbin/tuned -l -P
方法二:使用sort
您还可以将ps aux命令的输出通过管道传输到sort命令,并使用列号(1到11)选择要用于排序的列。
这种方法有两个缺点:1)列标题将与ps输出的其余部分一起排序,可能会在您不希望看到的地方结束;
2)当排序需要数值时,您需要在sort命令中添加一个“n”。
ps命令理解这种区别;像这样的命令会根据内存使用情况进行排序。sort命令使用"-nk 4"对排序输出中的(-k 4) 4 th 数据列进行数字排序。
[root@KSSHUAT00339 ~]# ps aux | sort -rn -k 4
root     30584  1.2 12.4 5976832 1015716 ?     Sl   Oct06  35:18 /opt/jdk8/bin/java -jar /opt/promotion/app/20221006193159/promotion.calculate.service.jar --spring.profiles.active=kfcd_uat --properties.application.version=v3_0_0 --properties.application.port=14312
root     30169  1.7  8.7 5908996 713448 ?      Sl   Oct06  50:49 /opt/jdk8/bin/java -jar /opt/promotion/app/20221006193159/promotion.loading.service.jar --spring.profiles.active=kfcd_uat --properties.application.version=v3_0_0 --properties.application.port=14311
root     22288  1.0  0.7 522420 62788 ?        Tl   Jul14 1239:22 ./titanagent -d
root      5147  0.0  0.3 626692 29508 ?        Ssl  Apr18  31:57 /usr/sbin/rsyslogd -n
root      5512  0.0  0.2 462668 17256 ?        Sl   Apr18  58:46 easy_monitor
root      5501  0.2  0.2 382108 16720 ?        S    Apr18 677:00 easy_collector
root      5500  0.2  0.2 320656 17512 ?        S    Apr18 501:22 easy_collector
root      5145  0.1  0.2  63332 16444 ?        Ssl  Apr18 381:48 /usr/share/filebeat/bin/filebeat -c /etc/filebeat/filebeat.yml -path.home /usr/share/filebeat -path.config /etc/filebeat -path.data /var/lib/filebeat -path.logs /var/log/filebeat
root      2523  0.0  0.2  55856 20328 ?        Ss   Apr18  15:01 /usr/lib/systemd/systemd-journald
root      5505  0.0  0.1 300592 14568 ?        Sl   Apr18  20:22 simple_collector
root      5497  0.1  0.1 376660 14764 ?        Sl   Apr18 393:30 easy_collector
root      5478  0.0  0.1 536952 13044 ?        Sl   Apr18 146:40 ./bin/easyAgent
root      5148  0.0  0.1 573920 15356 ?        Ssl  Apr18  55:00 /usr/bin/python2 -Es /usr/sbin/tuned -l -P
root      5142  0.0  0.1 227836  9220 ?        Ss   Apr18 134:04 /usr/sbin/snmpd -LS0-6d -f
USER       PID %CPU %MEM    VSZ   RSS TTY      STAT START   TIME COMMAND
root       951  0.0  0.0      0     0 ?        S    Apr18   0:00 [irq/16-vmwgfx]
root       947  0.0  0.0      0     0 ?        S<   Apr18   0:00 [ttm_swap]
root         9  0.1  0.0      0     0 ?        S    Apr18 409:40 [rcu_sched]
方法三:使用top
在 Linux 中查找内存消耗最大的进程
top -c -b -o +%MEM | head -n 20
如果你只想查看命令名称而不是命令的绝对路径,请使用下面的 top 命令格式。
top -b -o +%MEM | head -n 20