Htop
refer to : https://htop.dev/
https://linuxtogether.org/htop-command-explanation/
https://cloud.tencent.com/developer/article/1115041
安装
dnf install htop
Understanding Output of htop Command
Every Linux administrator and users have must come across the situation where the system has reached its saturation point and it starts consuming all of the resources allocated to it. At this particular time, we wholeheartedly want to identify the processes responsible for consuming such high resource usage. To identify such processes, we have many tools and commands available nowadays, but the best among all is htop.
htop allows you to monitor processes running on the system along with their full command lines. We can perform tasks related to processes (killing, renicing) without entering their PIDs. Htop allows us to sort the processes on the basis of CPU, Memory and Time Interval. It also allows us to sort all the processes owned by a particular user.
In our today’s tutorial, we are providing the detailed information about the usage of htop command for system monitoring. In our previous tutorial, we have demonstrated gtop. It is another command line system monitoring dashboard for Linux.
Understanding CPU Usage in htop
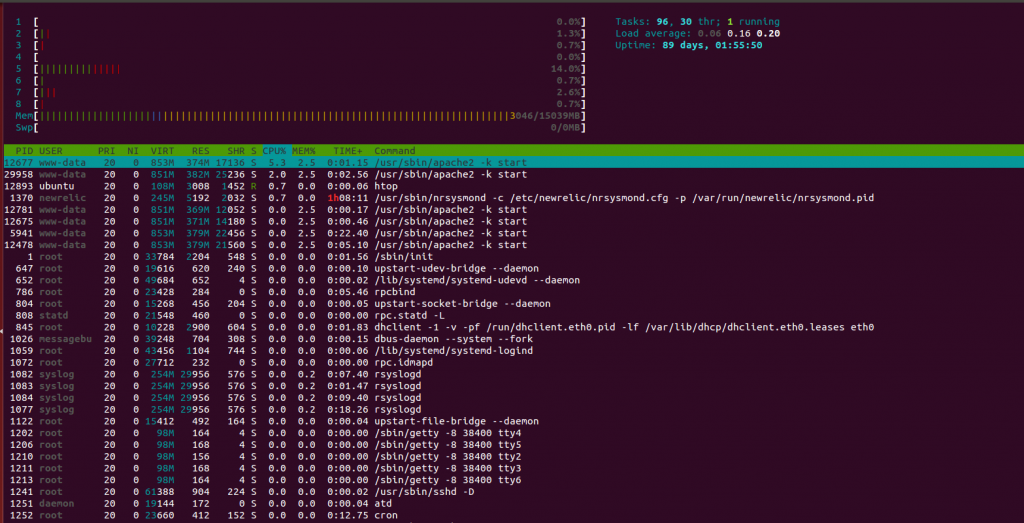
In reference to above screenshot, numbers 1 to 4 are the CPU/Cores of the system and the progress bar running next to it is describing its usage. One thing to notice here is that the progress bar contains multiple colors within it.
Have you ever wondered why there are multiple colors in progress bar?
Meaning and explanation of each color:
Blue: Display percentage of CPU used by low priority processes. (nice > 0)
Green: Displays percentage of CPU used for processes owned by normal users.
Red: Displays percentage of CPU used by system processes.
Orange: Displays percentage of CPU used by IRQ time.
Magenta: Displays percentage of CPU consumed by Soft IRQ time.
Grey: Displays percentage of CPU consumed by IO Wait time.
Cyan: Displays percentage of CPU consumed by Steal time.
Understanding Memory Usage in htop
Exactly below the CPU statistics, Memory and Swap usage are provided. Alike progress bars in CPU, Memory monitoring also contains progress bars with multiple colors.
Meaning and explanation of each color:
Green: Displays percentage of RAM consumed by memory pages
Blue: Displays percentage of RAM consumed by buffer pages
Orange: Displays percentage of RAM consumed by cache pages
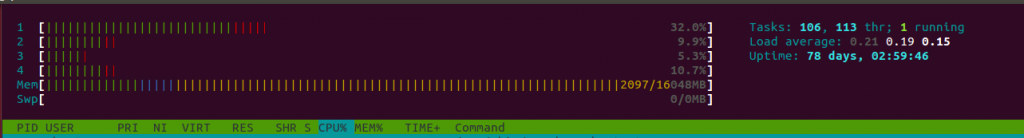
Understanding Tasks, Threads, Running Processes, Load Average and System’s Uptime in htop
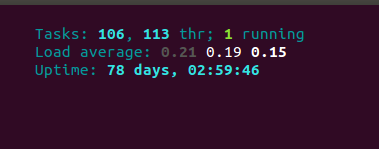
In reference to above screenshot, we have 106 tasks or processes running on the machine which are broken up into 113 threads and out of these only 1 process is in running state. You must be wondering, what are other processes doing then???
Tasks are the representation of the total number of open processes but not every open process is consuming CPU constantly. There are several states in which each process resides. Check these different states of processes below.
- R: Running – Refers to the processes actively using CPU.
- T/S: Traced/Stopped – Refers to the processes currently in stopped (paused) state.
- Z: Zombie or defunct – The process that has completed execution (via the exit system call) but still has an entry in the process table.
- S: Sleeping – Most common state for many processes. Generally, processes are in the sleep state for most of the time and perform small checks at a constant interval of time, or wait for user input before it comes back to running state.
Load Average: Refers to the Average load of the system. Three values are referring to the average load of a system for last minute, for last five minutes and for last 15 minutes.
Uptime: Refers to the system uptime since the last reboot.
Detailed Processes Information in htop

- PID – It describes the Process ID number.
- USER – It describes the process owner.
- PRI – It describes the process priority as viewed by the Linux kernel.
- N – It describes the process priority reset by the user or root.
- VIR – It describes the virtual memory that a process is consuming.
- RES – It describes the physical memory that a process is consuming.
- SHR – It describes the shared memory that a process is consuming.
- S – It describes the current state of a process.
- CPU% – It describes the percentage of CPU consumed by each process.
- MEM% – It describes the percentage of Memory consumed by each process.
- TIME+ – It displays the time since process execution has started.
- Command – It displays the full command execution in parallel to each process.
Shortcut Keys Used in htop
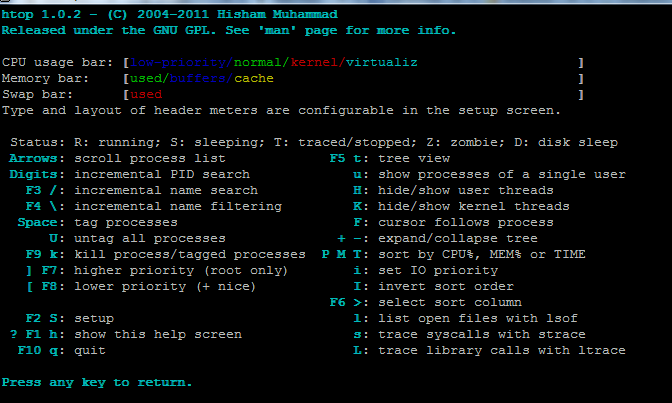
htop also has some shortcut keys to sort the process on basis of CPU, MEM or TIME consumption. It can also sort the processes owned by a particular user. See more details below.
- Arrow Keys – Use ‘Up and Down’ Arrow keys to scroll the processes in htop.
- u – Key ‘u’ is used to display all processes owned by a particular user.
- P – Key ‘P’ is used to sort processes on the basis of high CPU consumption.
- M – Key ‘M’ is used to sort processes on the basis of high Memory consumption.
- T – Key ‘T’ is used to sort the processes on the basis of the time period.
- h – Key ‘h’ is used to open help window and watch more shortcuts not mentioned here.
This brings an end to this explanation of htop command. Using htop we can identify and troubleshoot various factors causing sluggishness and system bottlenecks. We can enhance the system performance by using htop and it is all time favorite monitoring tool for UNIX based operating systems. Share this tutorial if you find it useful and for any questions please post in comment section. Stay tuned for more updates. Thanks!!
Glances
refer to:
https://glances.readthedocs.io/en/latest/cmds.html
Install
dnf install glances

glances --version

glances
Interactive Commands
ENTER
Set the process filter
Note
On macOS please use CTRL-H to delete filter.
Filter is a regular expression pattern:
gnome: matches all processes starting with thegnomestring.*gnome.*: matches all processes containing thegnomestring
a
Sort process list automatically
- If CPU
>70%, sort processes by CPU usage - If MEM
>70%, sort processes by MEM usage - If CPU iowait
>60%, sort processes by I/O read and write
b
Switch between bit/s or Byte/s for network I/O
B
View disk I/O counters per second
c
Sort processes by CPU usage
i
Sort processes by I/O rate
m
Sort processes by MEM usage
Web Server Mode
https://glances.readthedocs.io/en/latest/quickstart.html#web-server-mode
If you want to remotely monitor a machine, called server, from any device with a web browser, just run the server with the -w option:
server$ glances -w
then on the client enter the following URL in your favorite web browser:
http://@server:61208
where @server is the IP address or hostname of the server.
To change the refresh rate of the page, just add the period in seconds at the end of the URL. For example, to refresh the page every 10 seconds:
http://@server:61208/10
How to protect your server (or Web server) with a login/password ?
You can set a password to access to the server using the --password. By default, the login is glances but you can change it with --username.
Restful API
https://glances.readthedocs.io/en/latest/api.html
可以通过接口,获取到服务器的硬件信息、网络信息等
The Glances Restfull/API server could be ran using the following command line:
# glances -w --disable-webui
后台运行
Glance 如何以daemon的形式,在后台运行呢?
您可以使用以下命令让 Glances 在主要客户端的后台运行:
glances -w &
要结束所有活动的扫视会话,请键入以下命令以在后台模式下完成处理器:
sudo killall glances
另外,可以使用systemctl来实现后台运行glances
https://www.linuxmi.com/glances-monitor-linux.html
https://cn.linux-console.net/?p=13935
cd /usr/lib/systemd/system/glances.service
[root@VM-4-12-opencloudos system]# cat glances.service
[Unit]
Description=Glances Web server
Documentation=https://nicolargo.github.io/glances/
After=network.target

[Service]
ExecStart=/usr/bin/glances -w
Restart=on-abort

[Install]
WantedBy=multi-user.target
在后台运行Restfull
glances -w --disable-webui -t 15 &
-t`` TIME``, ``--time`` TIME
set refresh time in seconds [default: 3 sec]
iftop
refer to : https://pdw.ex-parrot.com/iftop/
Install
dnf install iftop
iftop 是 Linux 系统一个免费的网卡实时流量监控工具,类似于 top 命令。iftop 可以监控指定网卡的实时流量、端口连接信息、反向解析 IP 等,还可以精确显示本机网络流量及网络内各主机和本机相互通信的流量集合,非常适合于监控代理服务器或路由器的网络流量。
同时,iftop 对检测流量异常的主机非常有效,通过 iftop 的输出可以迅速定位主机流量异常的根源,这对于网络故障排查、网络安全检测是十分有用的。缺点就是无报表功能,且必须以 root 身份才能运行。
Usage
常用参数
-i 指定需要检测的网卡, 如果有多个网络接口,则需要注意网络接口的选择,如:# iftop -i eth1
-B 将输出以 byte 为单位显示网卡流量,默认是 bit
-n 将输出的主机信息都通过 IP 显示,不进行 DNS 解析
-N 只显示连接端口号,不显示端口对应的服务名称
-F 显示特定网段的网卡进出流量  如: iftop -F 192.168.85.0/24
-h 帮助,显示参数信息
-p 以混杂模式运行 iftop,此时 iftop 可以用作网络嗅探器
-P 显示主机以及端口信息
-m 设置输出界面中最上面的流量刻度最大值,流量刻度分 5 个大段显示  如:# iftop -m 100M
-f 使用筛选码选择数据包来计数  如 iftop -f filter code
-b 不显示流量图形条
-c 指定可选的配置文件,如:iftop  -c config file
-t 使用不带 ncurses 的文本界面,
    以下两个是只和 -t 一起用的:
    -s num num 秒后打印一次文本输出然后退出,-t -s 60 组合使用,表示取 60 秒网络流量输出到终端
    -L num 打印的行数
-f 参数支持 tcpdump 的语法,可以使用各种过滤条件。
界面操作
安装完 iftop 工具后,直接输入 iftop 命令即可显示网卡实时流量信息。
在默认情况下,iftop 显示系统第一块网卡的流量信息,如果要显示指定网卡信息,可通过“-i”参数实现。
执行iftop -P -i eth0命令,得到如下图所示的 iftop 的一个典型输出界面。
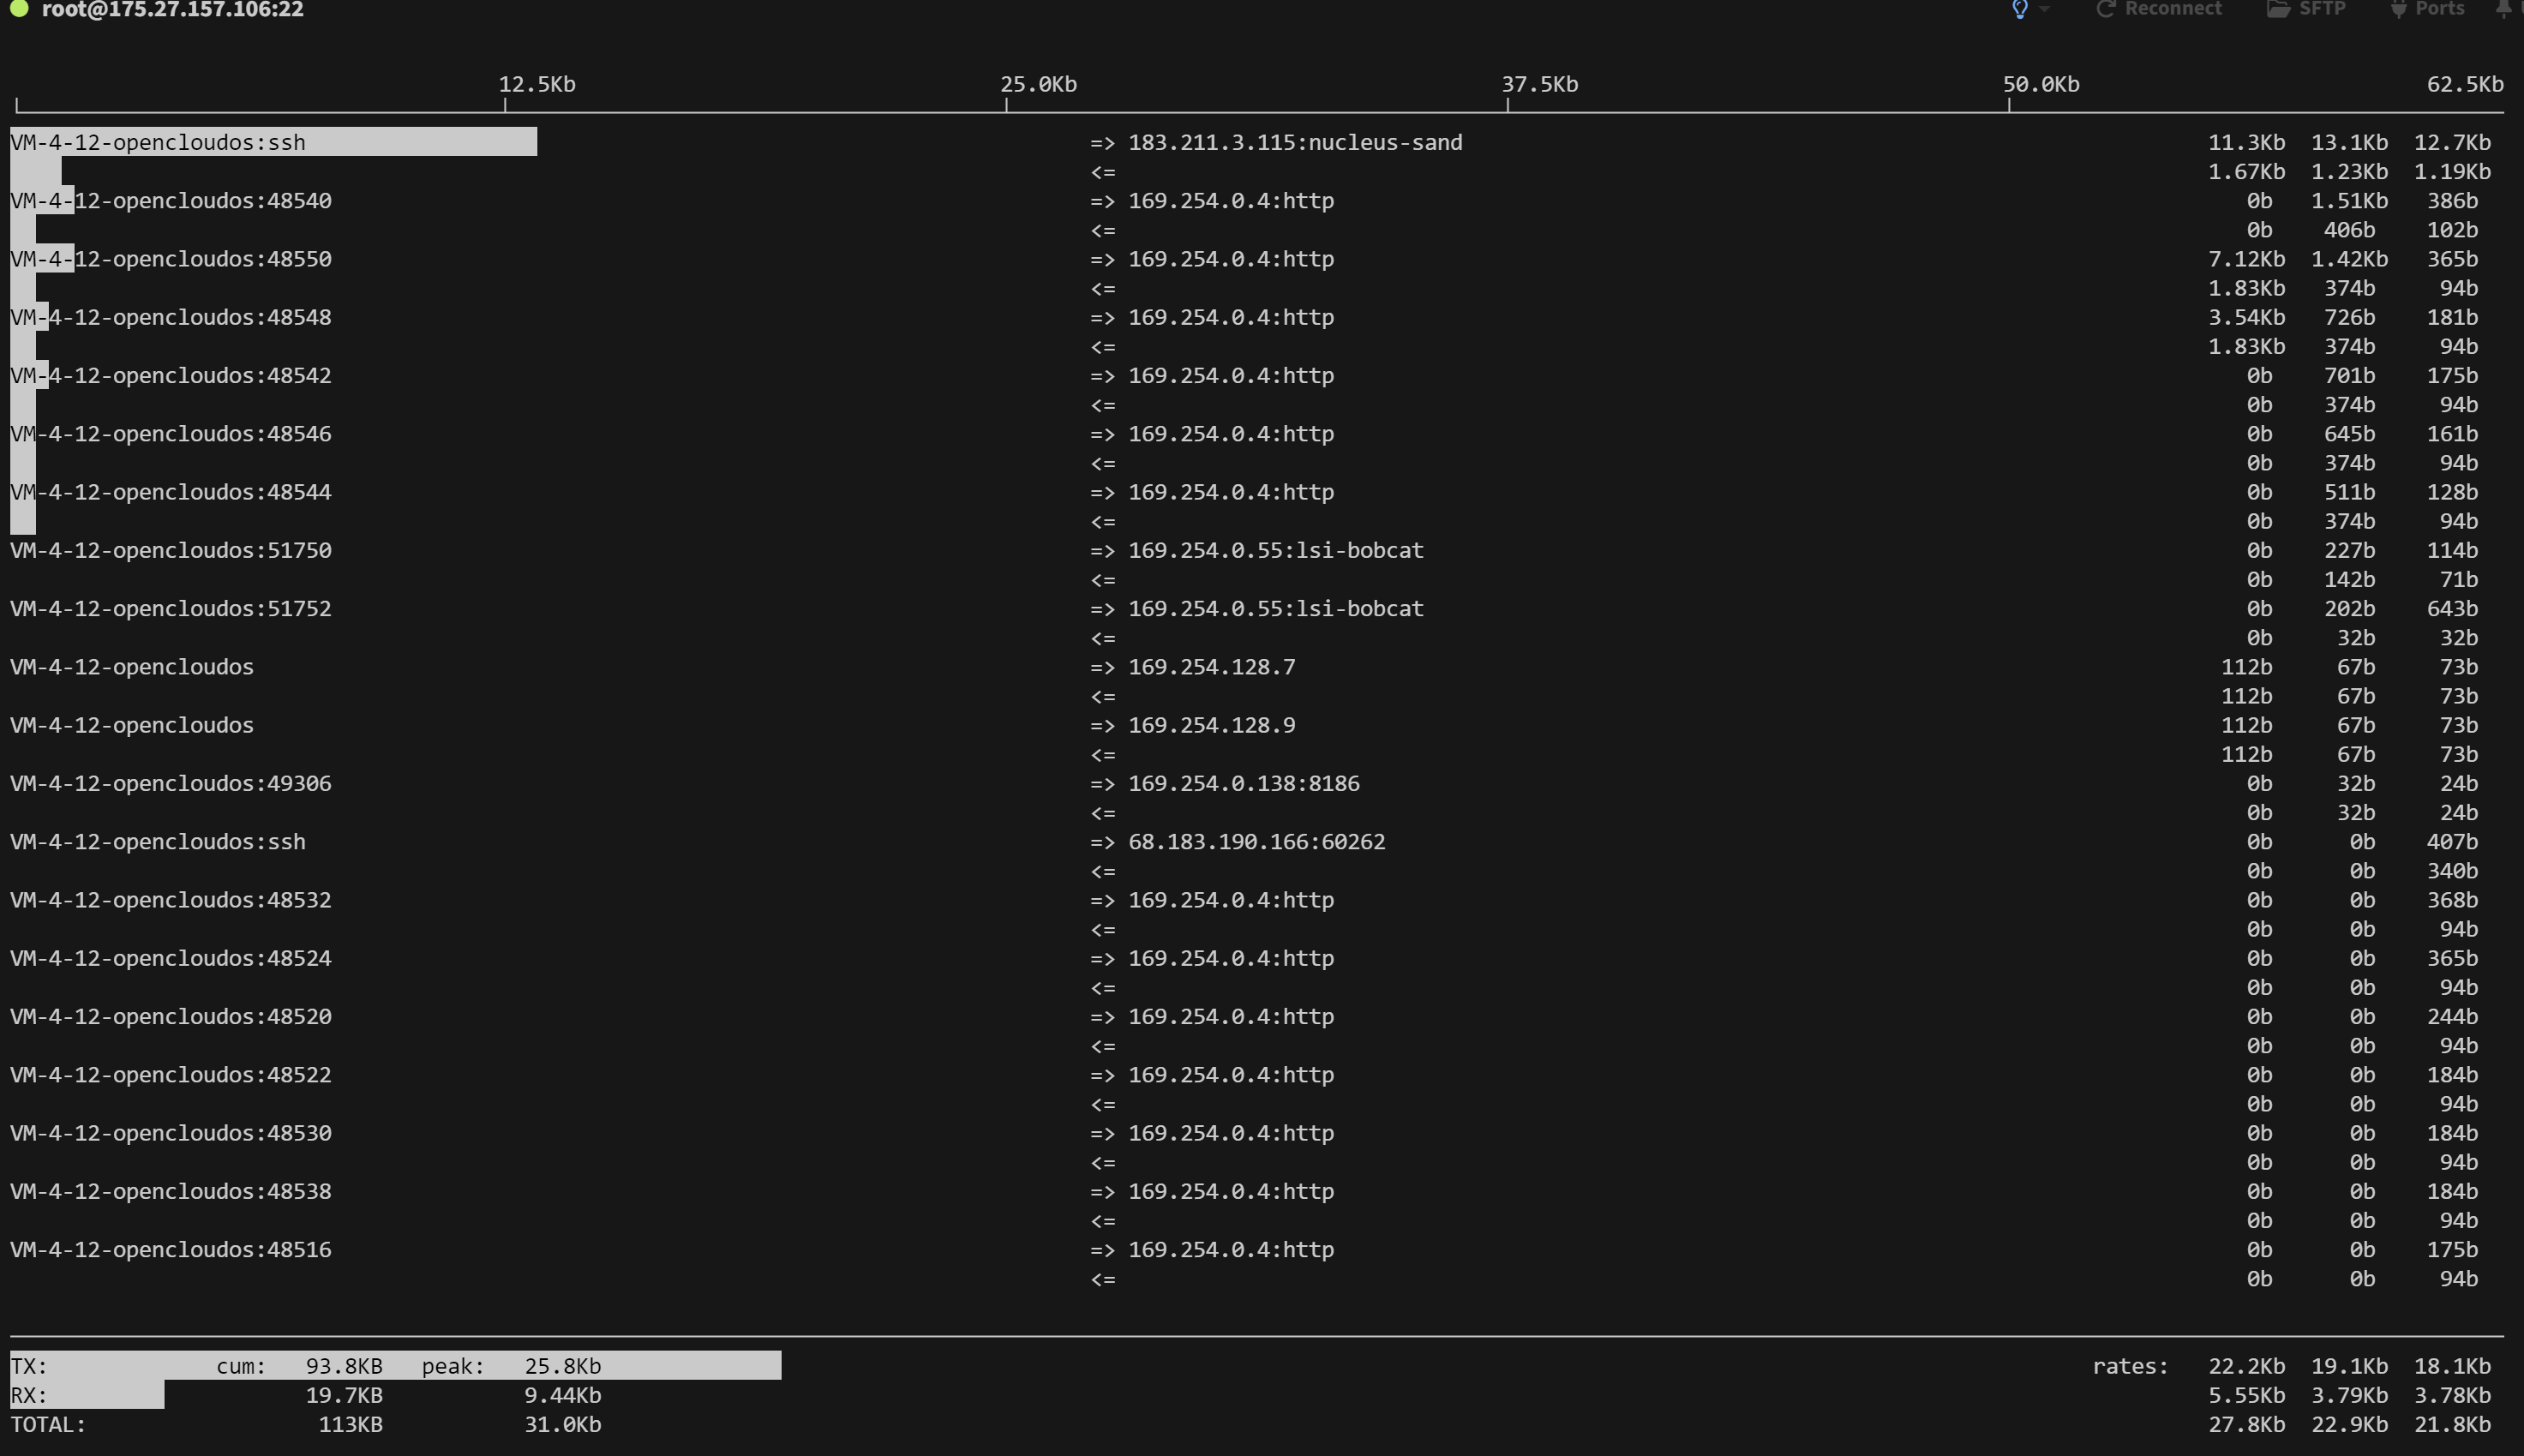
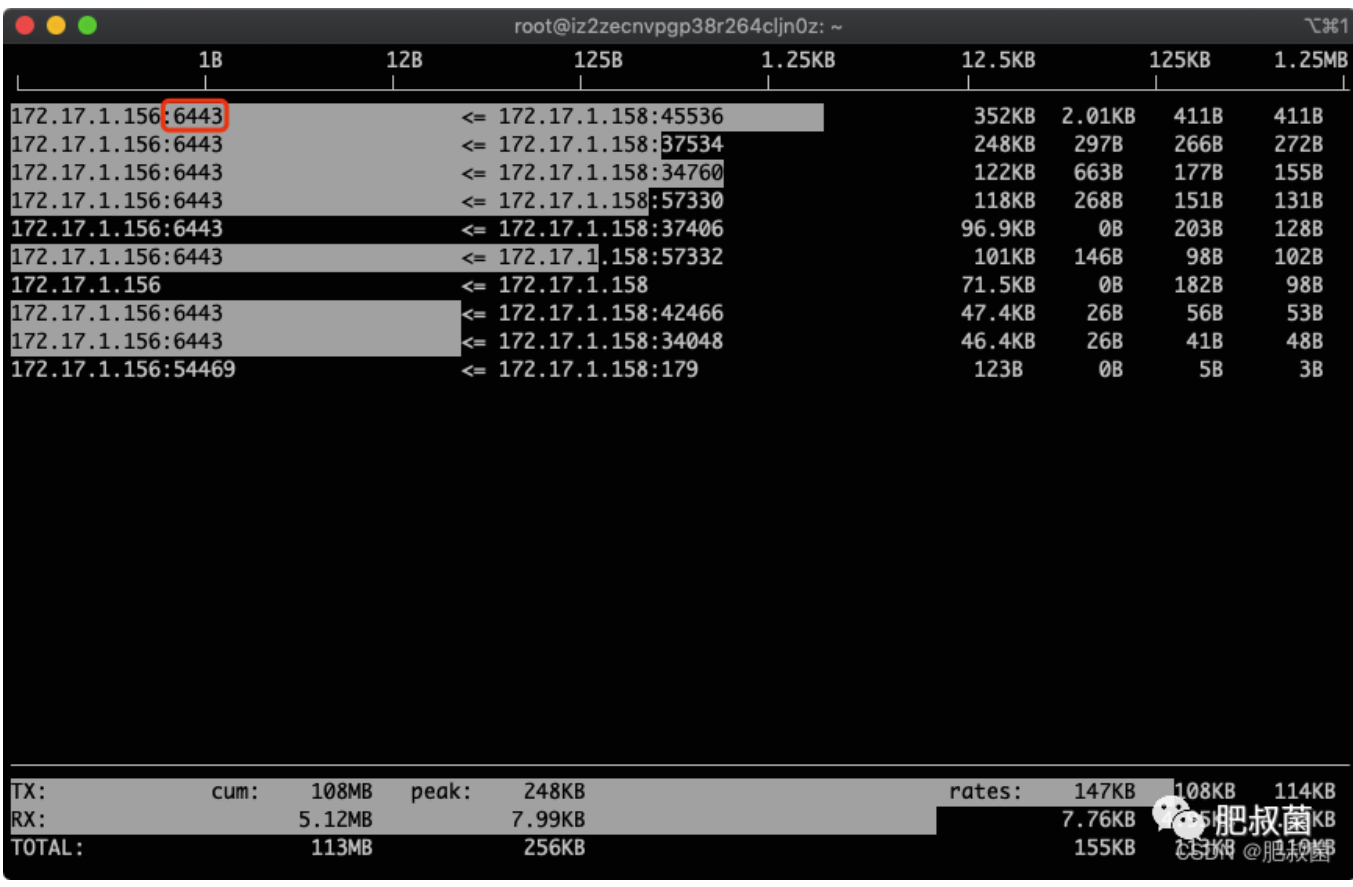
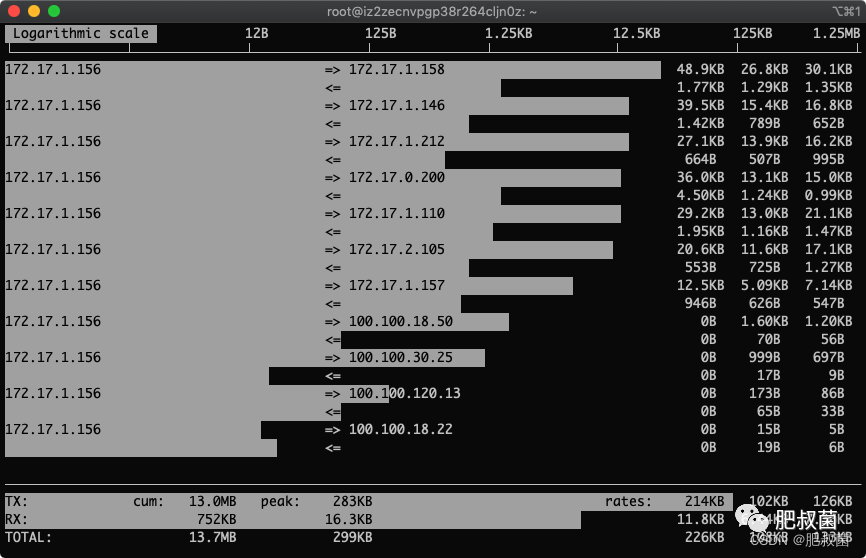
第一部分:iftop 输出中最上面的一行,此行信息是流量刻度,用于显示网卡带宽流量。
第二部分:此部分为分割线中间的部分,其中又分别分为左、中、右三列。
左列和中列,记录了哪些 IP 或主机正在和本机的网络进行连接。其中,中列的“=>”代表发送数据,“<=”代表接收数据,通过这个指示箭头可以很清晰地知道两个 IP 之间的通信情况。
最右列又分为三小列,这些实时参数分别表示外部 IP 连接到本机 2 秒内、10 秒内和 40 秒内的平均流量值。
另外,这个部分还有一个流量图形条,流量图形条是对流量大小的动态展示,以第一部分中的流量刻度为基准。通过这个流量图形条可以很方便地看出哪个 IP 的流量最大,进而迅速定位网络中可能出现的流量问题。
第三部分:位于 iftop 输出的最下面,可以分为三行,其中,“TX”表示发送数据,“RX”表示接收数据,“TOTAL”表示发送和接收全部流量。
与这三行对应的有三列,其中,
“cumm”列表示从运行 iftop 到目前的发送、接收和总数据流量。
“peak”列表示发送、接收以及总的流量峰值。
“rates”列表示过去 2s、10s、40s 的平均流量值。
2、交互操作
在 iftop 的实时监控界面中,还可以对输出结果进行交互式操作,用于对输出信息进行整理和过滤,在上图所示界面中,按键 “h” 即可进入交互选项界面,如下图所示。iftop 的交互功能和 Linux 下的 top 命令非常类似,交互参数主要分为 4 个部分,分别是一般参数、主机显示参数、端口显示参数和输出排序参数。相关参数的含义如下表所示。
参数 含义
P 通过此键可切换暂停/继续显示
h 通过此键可在交互参数界面/状态输出界面之间来回切换
b 通过此键可切换是否显示平均流量图形条
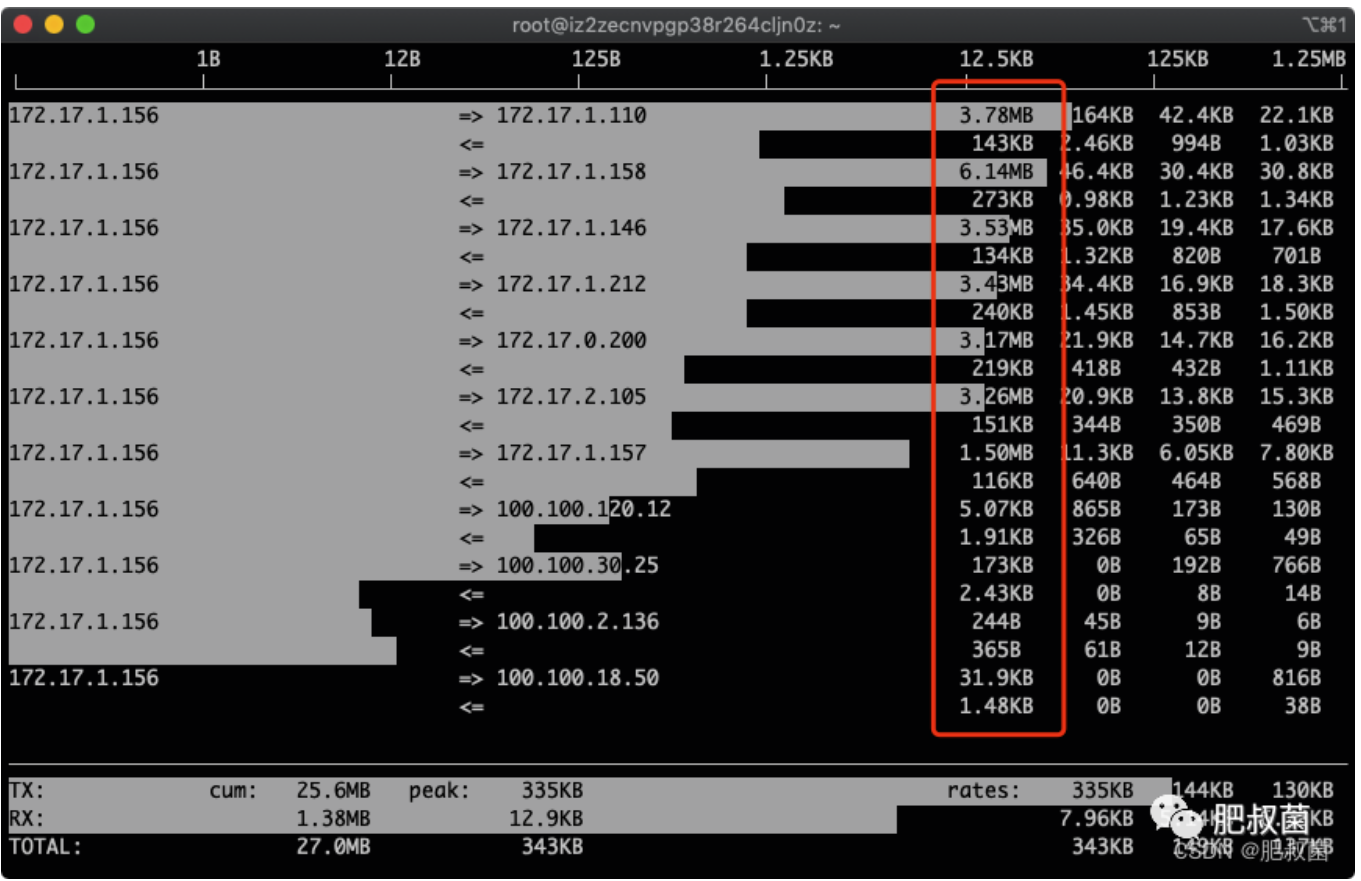
B 通过此键可切换显示2秒、10秒、40秒内的平均流量
T 通过此键可切换是否显示每个连接的总流量
j/k 按j键或k键可以向上或向下滚动屏幕显示当前的连接信息
l 通过此键可打开iftop输出过滤功能,比如输入要显示的IP,按回车后,屏幕就只显示与这个IP相关的流量信息
L 通过此键可切换显示流量刻度范围,刻度不同,流量图形条会跟着变化
q 通过此键可退出iftop流量监控界面
n 通过此键可使iftop输出结果以IP或主机名的方式显示
s 通过此键可切换是否显示源主机信息
d 通过此键可切换是否显示远端目标主机信息
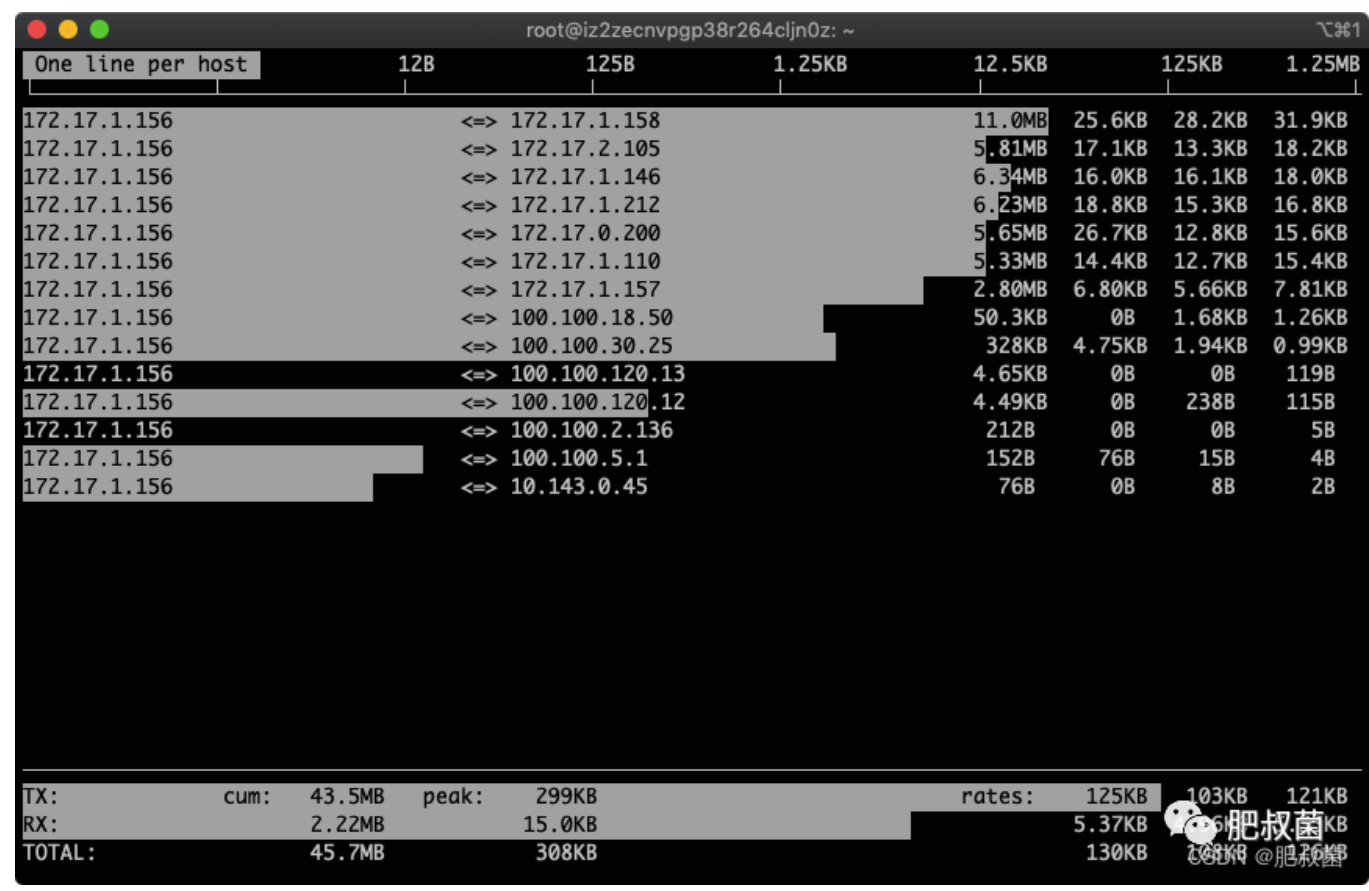
t 通过此键可切换iftop显示格式,连续按此键可依次显示:以两行显示发送接收流量、以一行显示发送接收流量、只显示发送流量/接收流量
N 通过此键可切换显示端口号/端口号对应服务名称
S 通过此键可切换是否显示本地源主机的端口信息
D 通过此键可切换是否显示远端目标主机的端口信息
p 通过此键可切换是否显示端口信息
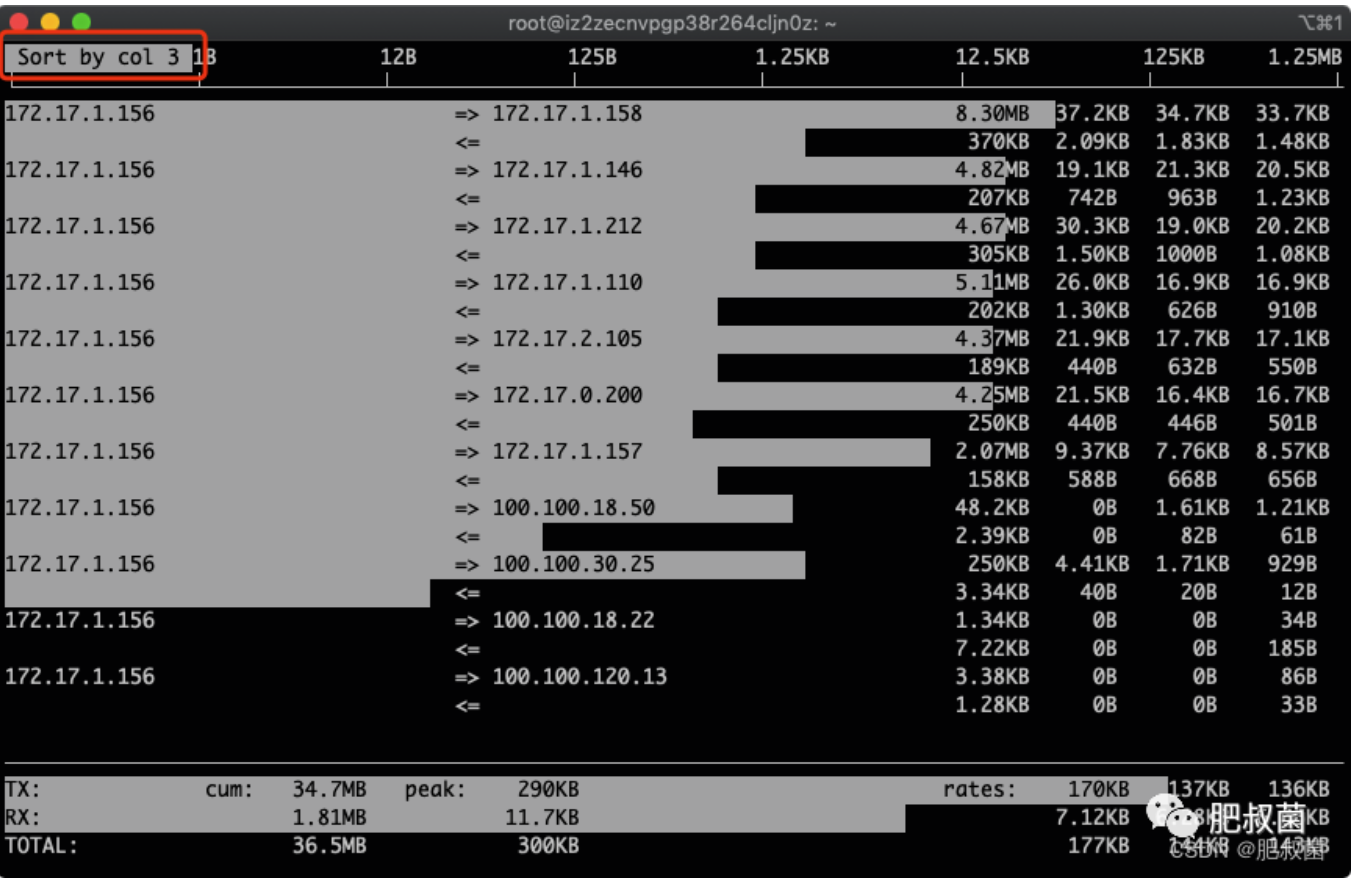
1/2/3 根据最近 2 秒、10 秒、40 秒的平均网络流量排序
< 通过此键可根据左边的本地主机名或IP地址进行排序
> 通过此键可根据远端目标主机的主机名或IP地址进行排序
o 通过此键可切换是否固定显示当前的连接
3、使用示例
显示网卡eth0的信息,主机通过ip显示:iftop -i eth0 -n
显示端口号(添加-P参数,进入界面可通过p参数关闭):iftop -i eth0 -n -P
显示将输出以byte为单位显示网卡流量,默认是bit:iftop -i eth0 -n -B
显示流量进度条:iftop -i eth0 -n(进入界面后按下L)
显示每个连接的总流量:iftop -i eth0 -n(进入界面后按下T)
显示指定ip 172.17.1.158的流量:iftop -i eth0 -n(进入界面后按下l,输入172.17.1.158回车)
示例
进入界面:iftop -i eth0 -nNB -m 10M 【-i 指定网卡;-n 代表主机通过ip显示不走DNS;-N 只显示连接端口号,不显示端口对应的服务名称(不加会显示如ssh这样的服务名称,不便于排查);-B 指定显示单位为Kb,默认是bit,太小;-m 设置输出界面中最上面的流量刻度最大值,流量刻度分5个大段显示】
进入后界面如下:
按下L显示流量刻度:
按下T显示总量:
按下3,根据最近40s统计排序:
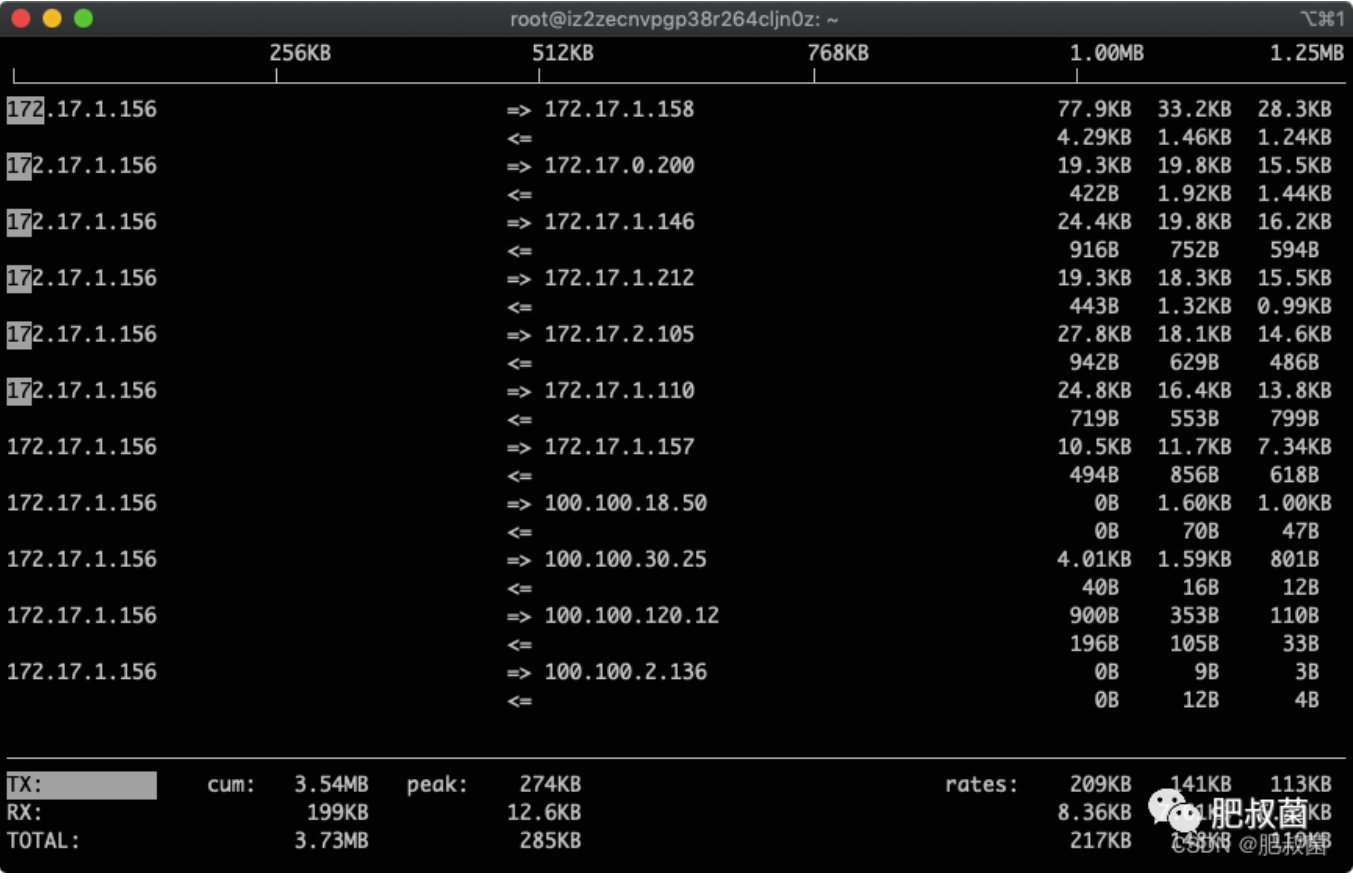
按下t,发送和接受合成一行:
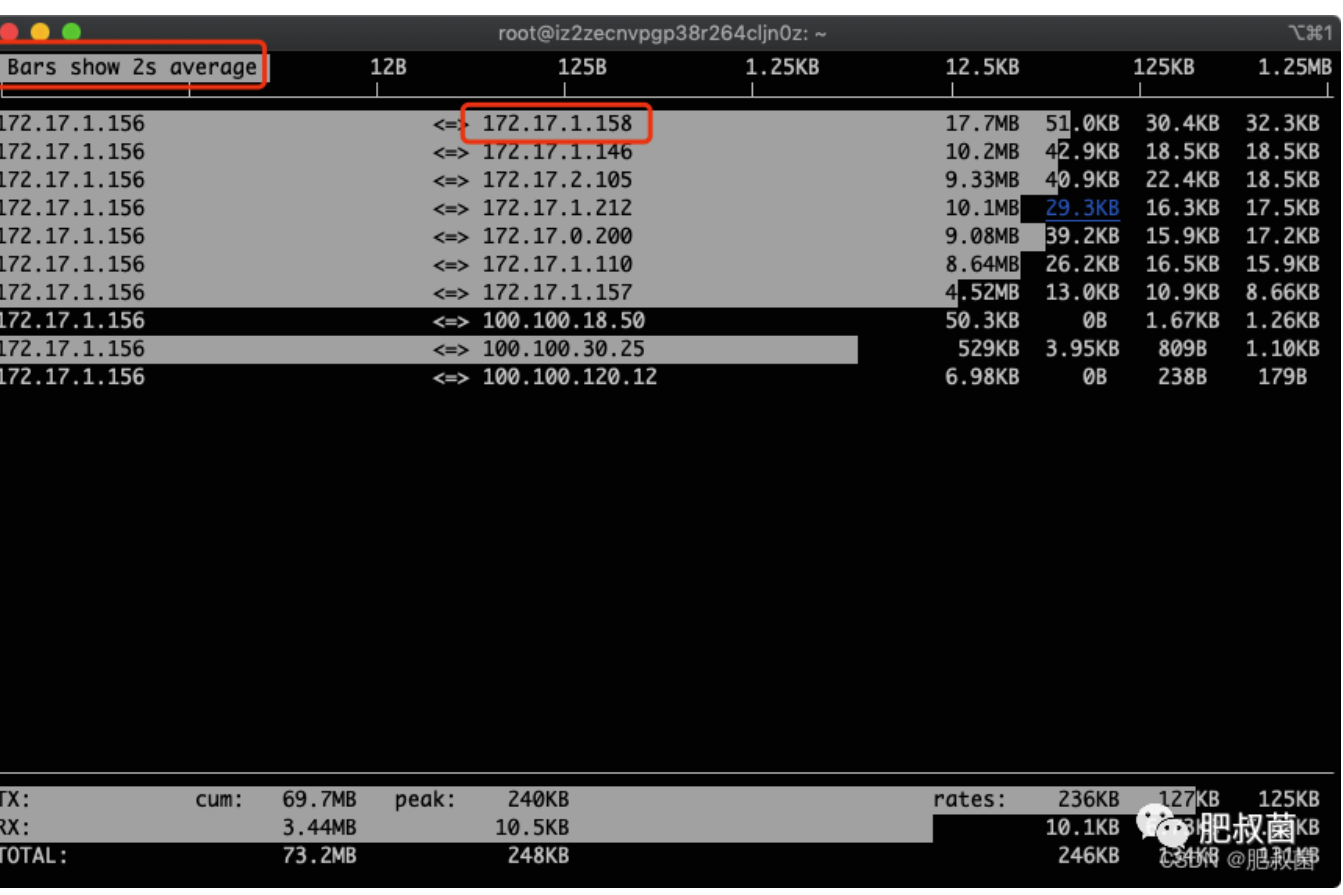
多按几次B,查看最近2s、10s、40s的统计:图中的172.17.1.158就是我们找到的流量用得最多的IP
筛选指定IP 172.17.1.158:按下l, 输入172.17.1.158,出现如下
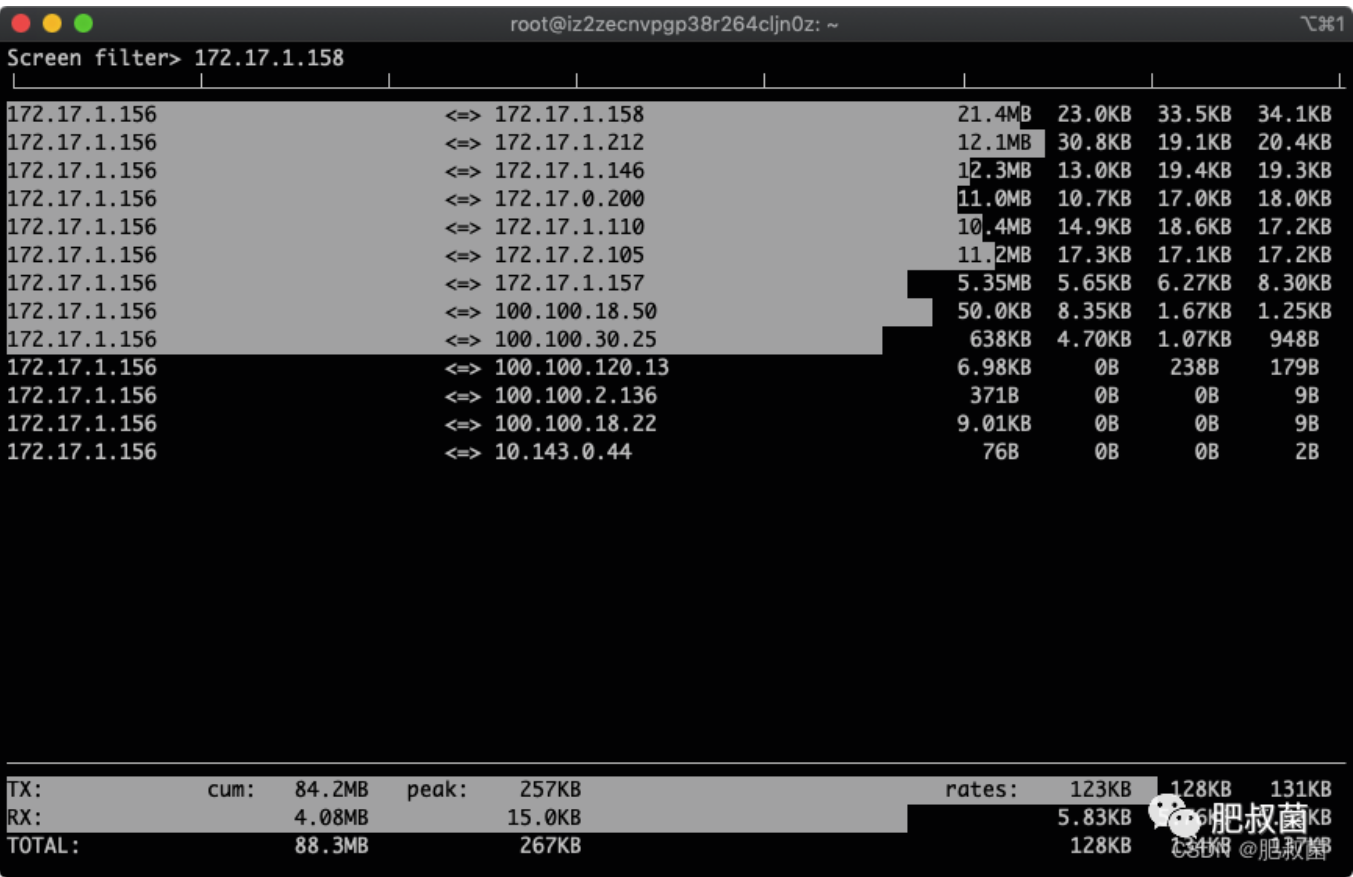
回车,生效
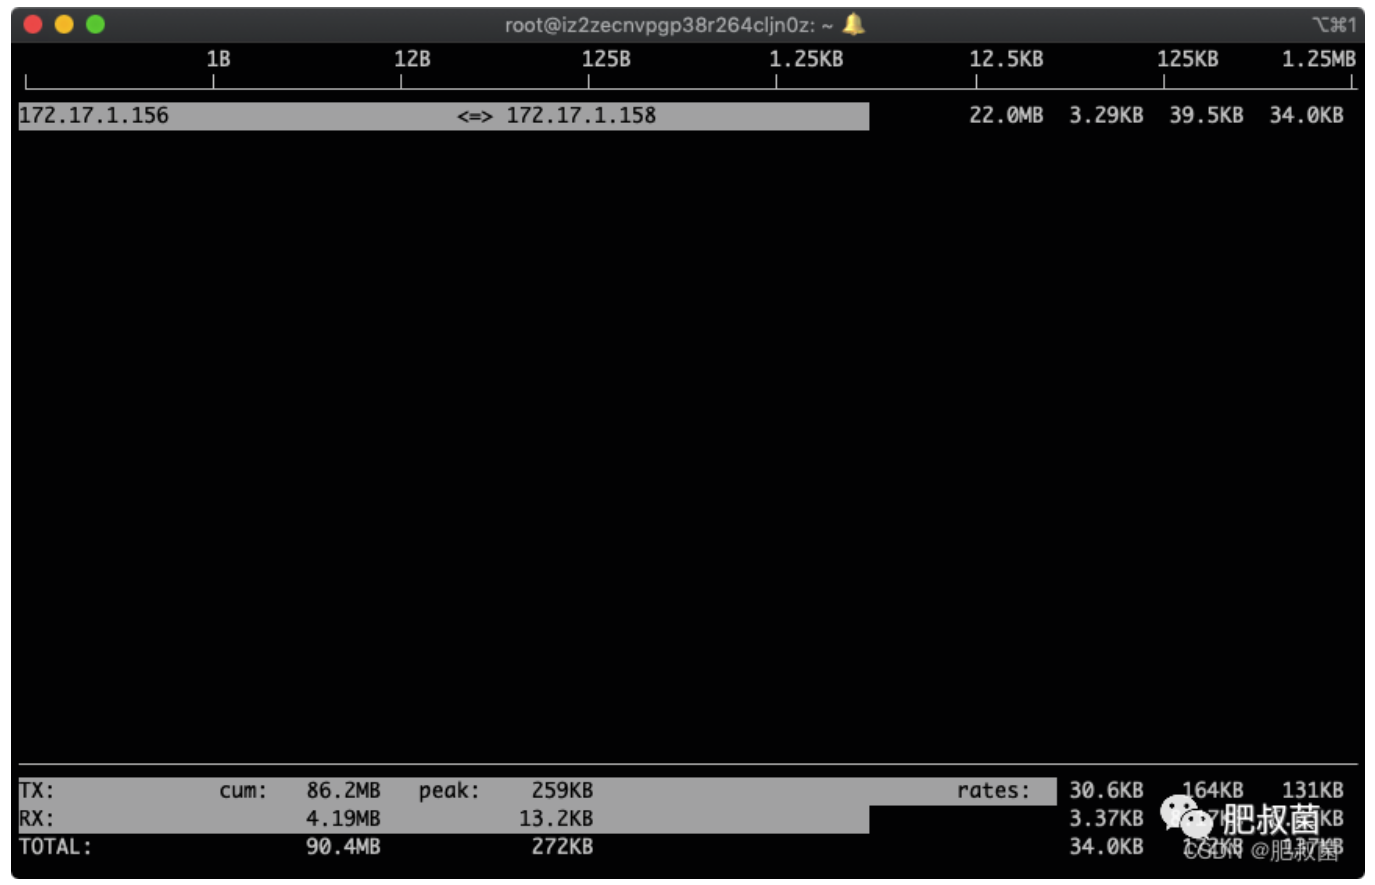
找到这个ip哪个端口流量用得最多